Online video has become the beating heart of digital life. From bite-sized TikToks to hours-long livestreams, billions of people hit “play” every day, and the sheer scale of it is staggering. We’re not just watching more—we’re watching everywhere: on websites, inside apps, on our mobiles, on smart TVs, and even during the daily commute with the sound off.
The numbers reveal just how universal this habit has become. Whether it’s finding out how long we stick with a video on average, figuring out which platforms dominate, or asking what percentage of clips truly go viral, every statistic paints a picture of video’s rise as the internet’s most powerful medium.
This post pulls together the latest research, breaking down who’s watching, how much time they spend, what devices they use, and what kinds of videos capture attention the most. If you’ve ever wondered just how deep our obsession with online video runs, the answers are right here in the numbers.
How many people watch videos online?
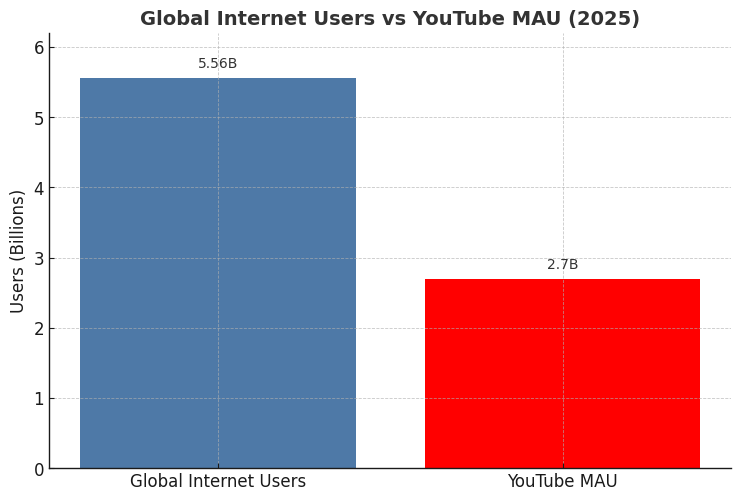
Watching videos online isn’t a niche pastime—it’s full on mainstream. In 2023 more than 3 billion internet users streamed or downloaded videos at least once per month—that works out to almost 40 percent of the world’s population. That’s a massive chunk of humanity clicking play.
Daily engagement is striking too. Back in January 2018, about 50 percent of internet users in the U.S. reported watching online video content every single day, and in Saudi Arabia that figure jumped to 64 percent. Another chart suggests that daily video habits vary significantly by country—with some reaching well over 60 percent.
If you’re wondering how that stacks up against YouTube’s footprint, as of mid‑2025 the platform boasted around 2.7 billion monthly active users, with folks collectively watching over 1 billion hours of videos each day. That’s no small feat—it shows how much of a go‑to video resource YouTube is.
| Metric | Estimated Value |
| Internet users watching video monthly | Over 3 billion (~40% of world pop.) |
| U.S. daily video-watchers (2018) | ~50 percent |
| Saudi Arabia daily video-watchers (2018) | ~64 percent |
| YouTube monthly active users (2025) | ~2.7 billion |
| YouTube daily hours watched globally | Over 1 billion hours |
Those numbers speak volumes. Online video is woven into everyday life—from casual browsing to serious streaming. Whether it’s a quick clip, a how‑to tutorial, or binging a mini‑series, people across the globe are hitting play—and plenty of them, consistently.
75% of all videos online are watched on mobile
Video has become almost synonymous with mobile viewing, and the numbers show just how dominant small screens really are. Nearly three-quarters of global video plays are happening on mobile devices, with most industry data placing the share anywhere from 57% up to 75%.
In fact, many reports agree that around three out of every four videos online are now consumed on mobile, whether that means a smartphone on the go or a tablet curled up on the sofa.
The popularity of platforms like TikTok, Instagram Reels, and YouTube Shorts has only accelerated this trend, as their design caters perfectly to vertical, quick, swipe-friendly mobile experiences.
At the same time, long-form content hasn’t disappeared—streaming platforms still thrive—but even there, mobile is gaining ground as people increasingly watch films, series, and live events directly on their phones.
| Metric | Estimated Value |
| Share of video plays on mobile | 57–75% |
| Consumers watching video on smartphones | ~75% |
| Global trend direction | Strongly rising |
What stands out is that “mobile” isn’t just one device anymore. Smartphones take the lead, but tablets also command high engagement, with some surveys suggesting nearly 9 in 10 tablet owners use them for video. Add in better connectivity, like 5G rollouts and faster Wi-Fi, and mobile viewing is only becoming more seamless. The conclusion is hard to ignore: whether it’s short clips, social reels, livestreams, or even feature-length content, mobile is firmly the main stage for online video.
Do people watch videos on websites?
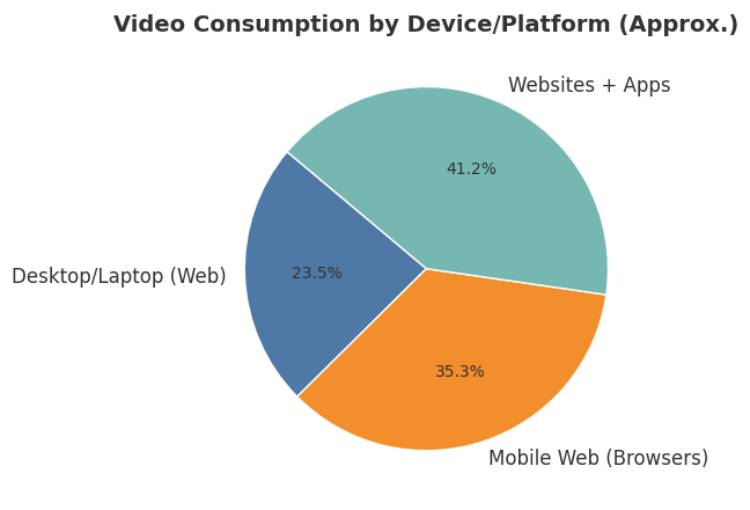

A surprising amount of people do still watch videos on websites—and it’s not a relic of the past. In fact, the largest share of video content consumption happens via web browsers, whether that’s on desktop or mobile site visits.
For instance, a breakdown of online video consumption by device size shows that across regions like North America, Europe, and Asia, the majority of video views happen on desktops/laptops via web, followed by mobile web, tablets, and smart TVs. That tells us people still go to sites—not just apps—to play videos.
It’s also worth noting that while 82.5% of all internet traffic comes from video, this includes streams viewed on websites, apps, and embedded players across various platforms. Meanwhile, mobile devices alone now generate around 60% of all website traffic, so there’s a solid chunk of video consumption happening through browsers on phones and tablets too.
Put it all together: websites remain a key avenue for video viewing, especially on desktops—but mobile web is steadily gaining ground thanks to how easily we can binge or browse from our browsers. It’s clear that whether users open up a browser tab or tap an app icon, websites are still holding their own in the video arena.
| Platform/Device | Insight |
| Desktop/Laptop (web) | Still dominates video consumption in many regions per device breakdown |
| Mobile Web (browsers) | Growing share—reflects rising mobile website usage (~60% of all web traffic) |
| Overall Web + Apps | Websites account for a significant portion of all video traffic |
How many videos are watched every day?
There’s more than one billion online video views happening every single day, just on YouTube alone. Reports suggest that nearly 5 billion videos are watched daily on the platform, which is nothing short of staggering. That means billions of times each day someone clicks play—whether it’s for a quick clip, vlog, or long-form watch.
Beyond YouTube, digging into broader trends reveals that we’re truly living through a video binge era. For instance, one source puts the number of daily video streamers at around 100 million users, each tuning into online content every single day. And when you add up all formats—full-length shows, livestreams, tutorials, short-form reels—those numbers keep stacking fast.
| Platform/Metric | Daily Video Watch Count |
| YouTube videos watched daily | Nearly 5 billion |
| Daily online video viewers | Over 100 million users |
| YouTube uploads per minute | 500+ hours worth (generates content) |
What’s clear is, the appetite for video content isn’t a flash in the pan—it’s part of daily life for billions, across work, play, education, or just killing time. Whether it’s YouTube’s colossal daily volume or the high count of daily streamers across platforms, the scenes paint a picture that video is one of the most consumed media types out there—no caveats, just cold hard numbers and us hitting that play button again and again.
How long does the average person watch a video?
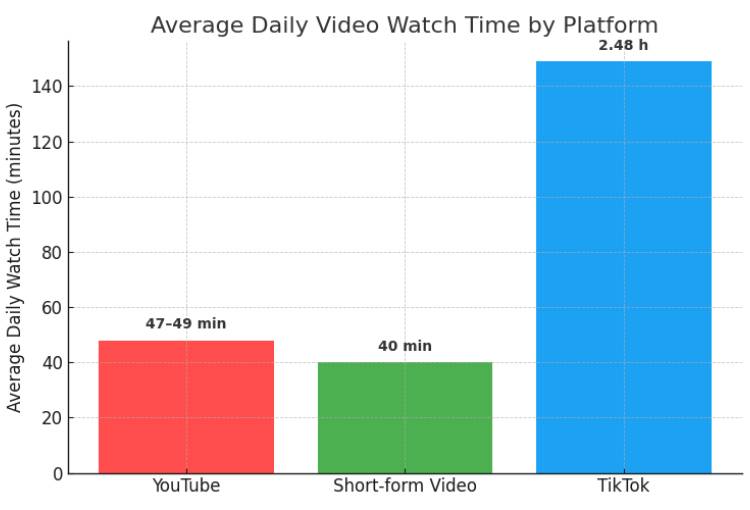

Digging into how long people actually watch videos, the story gets pretty fascinating. For instance, in the U.S., the average daily time spent watching YouTube alone has inched up steadily from roughly 39.7 minutes in 2019 to about 47.5 minutes by 2023, with a projection reaching nearly 48.7 minutes in 2024.
That steady climb speaks volumes about how watch habits evolve—no robotic monotony here. On a session level, YouTube users typically settle in for about 40 minutes per viewing session, which shows people are diving deeper than just quick scrolls.
When it comes to quick hits—the world of short-form videos—the average person spends around 1 hour and 16 minutes per day glued to bite-sized clips, and in the U.S., folks rack up nearly 58.4 hours monthly watching on platforms like TikTok. That’s behavior with staying power. Diving even deeper, TikTok watchers clock in at about 2.48 hours each day immersed in video content, a clear sign that these videos are built for bingeing.
| Type of Viewing | Average Watch Time |
| YouTube (daily U.S. users) | ~47–49 minutes per day |
| YouTube (per session) | ~40 minutes |
| Short-form video (daily) | ~1 hour 16 minutes |
| TikTok (daily) | ~2.48 hours |
Putting it all together, most people aren’t just hitting play for a few seconds—they’re sticking around. Short clips reel them in fast, but even full videos keep them locked in for nearly an hour a day. No fluff, just numbers that tell the story of how we really watch.
What is the most popular type of video?
If you had to place your bet, you’d probably say short-form vids like TikToks or Reels are killing it—and you’d be right. In a world where attention spans barely register, short-form content isn’t just popular—it’s pulling the crowds. Around 66 percent of consumers say short-form is the most engaging format, and 73 percent prefer it when they’re checking out products or services.
Behind the scenes, creators are cranking out these quick clips like there’s no tomorrow. On the marketing front, 54 percent of video producers stick with live-action, while 24 percent focus on animations, and 15 percent use screen recordings.
But when you ask what people actually watch, short-form takes the trophy. Gen Z and Millennials are especially hooked—57 percent of Gen Z prefer short clips for discovering new stuff, and short vids get 2.5 times more engagement than long-form hits.
Let’s break it down in a table:
| Video Format | Popularity & Engagement Insight |
| Short-Form Videos | Most engaging; preferred by 66%; 73% use them for searching |
| Live-Action (Marketing) | Most created type (~54%) |
| Animation & Screen-Cap | Follow behind live-action in usage by creators |
| Engagement Comparison | Short-form yields 2.5× more engagement than long-form |
So if you’re scrolling, swiping, or bingeing on your phone, chances are you’re chowing down on something quick, swipey, and short—made for the moment, optimized for our shrinking attention spans.
What is the most popular platform for videos?
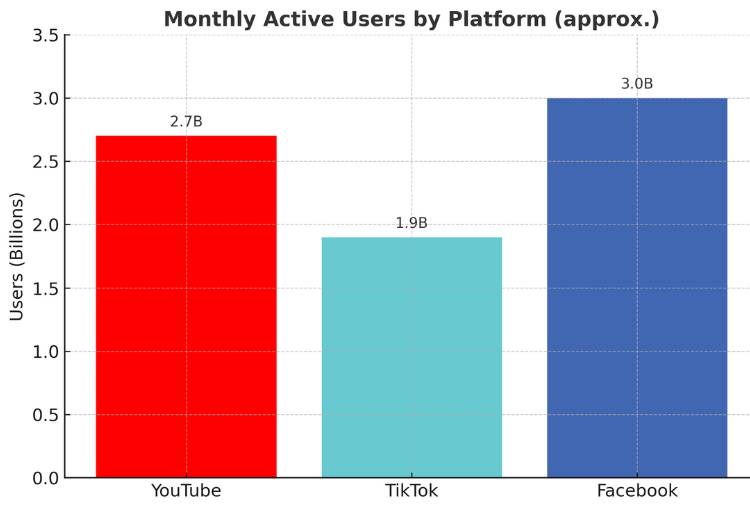

When it comes to sheer popularity, one platform towers above the rest: YouTube. With over 2.7 billion monthly active users as of mid-2025, that’s more than one-third of the globe’s social media crowd clicking “play” regularly. No other platform comes close to matching that kind of reach—Facebook sits just above it overall in social media user numbers, but for video-specific, YouTube remains king.
Still, the competition is fierce. TikTok, with its rapid growth among younger users, surpassed 1.9 billion global monthly users in 2024 and outpaced YouTube in advertising revenue—bringing in about $63.3 billion globally compared to YouTube’s $33.3 billion in the same period. Holed up in their bedrooms, teens especially are binge-watching TikToks—sometimes clocking in 82 minutes a day, even more than they’re spending on YouTube.
Let’s throw in a quick conversion to keep things real:
| Platform | Monthly Active Users (approx.) | Revenue (Video/Ad-based) |
| YouTube | ~2.7 billion | ~US$33 billion (ads) |
| TikTok | ~1.9 billion | ~US$63 billion globally (video ads) |
| ~3.0 billion (overall users) | — |
The bottom line? YouTube still rules the roost when it comes to overall video reach, especially across all age groups and content types. TikTok, though, is making major waves—especially with ad-driven growth and younger audiences glued to its quick-hit format.
Which social media platform is best for videos?
When weighing up which social media platform is best for videos, context is king—and the leader depends on what you’re after. For pure organic engagement, TikTok outpaces its peers—boasting a stellar 2.34% engagement rate, compared with 1.48% for Instagram Reels and 0.91% for YouTube Shorts. It also sparks roughly three times more conversations than Reels, making it the go-to if interaction and buzz are top priorities.
But if your aim is wide reach or marketing familiarity, YouTube holds serious weight—used by 90% of video marketers, it brings unmatched visibility. Meanwhile, Facebook follows closely behind, used by 86% of marketing professionals.
Looking at global platform popularity gives more context. YouTube reaches more people than any other video platform, claimed by 76% of social media users worldwide, earning it top honors in terms of sheer ubiquity. And by age, it dominates across generations in the U.S.—from 93% of users aged 18–29 to 86% in the 50–64 bracket.
Here’s how it stacks up:
| Platform | Strengths |
| TikTok | Highest engagement, conversation-driven, trend-heavy |
| YouTube | Widest reach, preferred by marketers, long-form-friendly |
| Instagram Reels | Strong for integrated campaigns within visual brand ecosystems |
Bottom line: If you crave engagement and culture, TikTok’s where conversations spark. For reach, longevity, or a marketer’s toolkit, YouTube still holds the crown. And Instagram Reels? They’re king when you need to weave video into a broader visual brand story.
How many people watch livestreams?
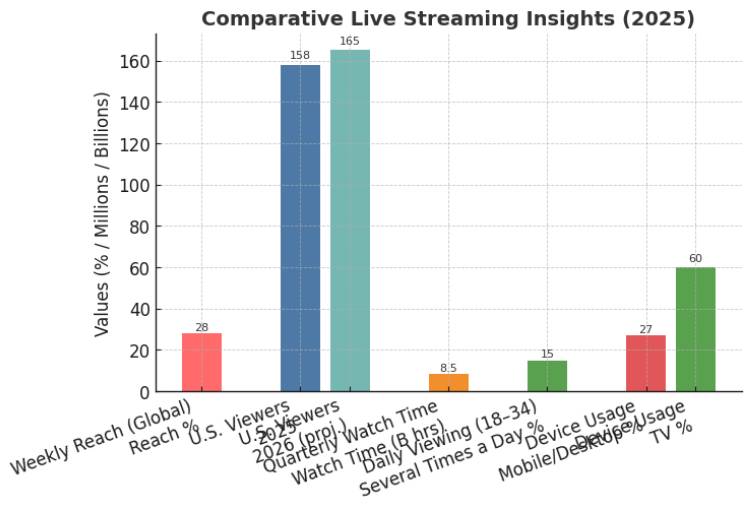

Live streams aren’t a fringe trend—they’re reaching serious numbers of eyeballs. Around 28 -percent of internet users worldwide tune into live streams weekly, a figure that has held relatively steady since its pandemic peak of 30.4 percent. That’s no small potatoes—almost one in three folks with internet access are hitting that “watch live” button at least once every week. In the United States, that translates to roughly 158 million people, with projections steering that number closer to 165 million by 2026.
When it comes to actual watch time, viewers across the globe are spending billions of hours each quarter glued to live content. For instance, during Q2 2024, combined live stream time topped 8.5 billion hours, which is the equivalent of nearly 970,000 years of continuous watching. That number also reflects a healthy upward trend—about a 10 percent year-over-year rise.
In the U.S., usage also skews younger: about 15 percent of people aged 18–34 say they watch live streaming content several times a day—way above the 8 percent in the 35–54 group, and just 3 percent for those 55 and up. When breaking it down by device, live streams are split—27 percent watch via mobile and desktop browsers, while a larger 60 percent of younger adults prefer tuning in on their TVs.
Putting it all in one visual would look something like this:
| Metric | Estimate & Insight |
| Weekly live stream reach globally | ~28% of internet users |
| U.S. live stream viewers | ~158 million (projected to reach ~165 million by 2026) |
| Quarterly global live watch time | ~8.5 billion hours |
| Year-over-year watch time growth | ~10% increase |
| Daily live-viewing frequency (18–34) | ~15% watch live stream several times a day |
| Device usage (U.S., younger adults) | 27% via mobile/desktop, 60% via TV |
Live streaming isn’t just a logical side hustle anymore—it’s a mainstream habit for a growing slice of the population.
Is Livestreaming growing?
The global livestreaming scene is absolutely on the up—and not just by a hair. The live streaming market soared from an estimated $87.6 billion in 2023 to nearly $99.8 billion in 2024, and it’s projected to reach a jaw-dropping $345 billion by 2030, cruising along at a compound annual growth rate of around 23% from 2024 to 2030. Another projection paints the industry booming from $99.8 billion in 2024 to $345.1 billion by 2030, reinforcing that same 23% CAGR.
And it’s not just about money—viewing time tallies are holding steady too. In Q2 2025 alone, livestreams across top platforms racked up over 29.6 billion hours watched, practically matching Q1 performance and signaling ongoing stability and demand.
On the consumer engagement side, live streams have shown deep regional uptake. Viewing time jumped 14% globally, but some regions saw explosive growth—Asia leapt 90%, Latin America soared 70%, while Europe and Oceania grew by 20% and 26%, respectively. Even North America saw modest but real gains of 5%.
| Metric | Insight |
| Market Value (2023 → 2030) | ~$87.6B → ~$345B, CAGR ~23% |
| Quarterly Watch Hours (Q2 2025) | ~29.6 billion hours, nearly flat from Q1 |
| Global Viewing Time Growth | +14% overall |
| Regional Growth Highlights | Asia +90%, LATAM +70%, Europe +20%, NA +5%, Oceania +26% |
These numbers clearly show that livestreaming isn’t just a passing fad—it’s rapidly scaling in both economic value and audience attention. From fast-growing markets to record-breaking engagement stats, the trend is unmistakable and compelling.
What percent of videos go viral?
What percentage of videos go viral? The short answer: a tiny fraction. Some deep dives into platform trends and shareable content reveal that only around 1% of all videos posted to major social platforms like Facebook ever manage to go viral—that means the vast majority never become internet sensations.
That one-in-a-hundred stat gives us a reality check: going viral is more like hitting the lottery than reaching your everyday viewer. Still, there’s behavior insight worth noting—like how 47% of marketers say short‑form videos are more likely to go viral, thanks to their snackable nature and quick share potential.
Here’s how odds stack up:
| Metric | Insight |
| Videos that go viral | Around 1% of all videos posted |
| Marketers saying short videos go viral more often | 47% believe short-form videos have higher virality chances |
So while there’s no hard-and-fast rule for “going viral,” these figures give you an idea how rare it really is—and what format tends to defy the odds more often.
Interesting fact: What percentage of people watch videos without sound?
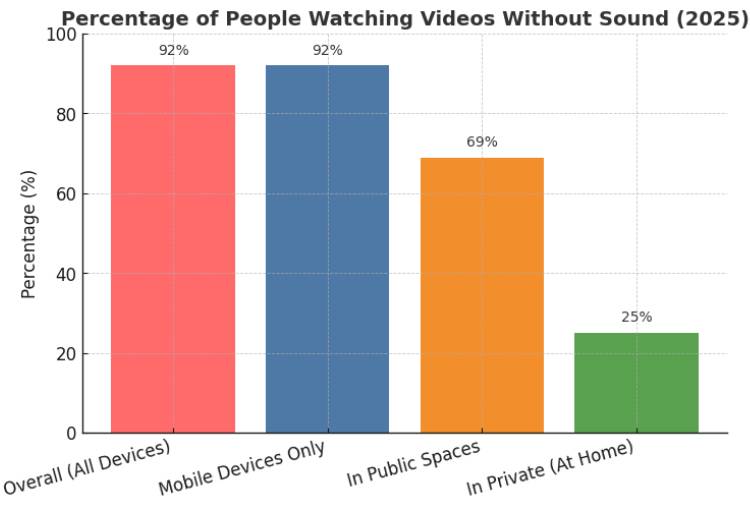

Here’s a compelling visual that shines a light on a surprising trend: a vast majority of videos are watched without sound—particularly on mobile and in public settings. The chart captures how viewers mute videos instinctively, and the statistics backing it speak volumes.
Studies reveal that around 92% of video consumption happens silently, meaning almost everyone who’s watching a clip on their phone isn’t turning the volume up. A deeper breakdown shows people in public spaces are especially cautious—69% of them mute videos, while that figure dips to 25% when they’re alone at home.
And when it comes to mobile viewing, silent playback hits 92%, compared to 83% across all devices—clearly emphasizing how on-the-go habits shape how people consume content.
| Viewing Context | Percentage Watching Without Sound |
| Overall (all devices) | ~92% |
| Mobile devices only | ~92% |
| In public spaces | ~69% |
| In private (at home) | ~25%
|
These figures make a simple point—sound-off viewing isn’t a niche behavior; it’s the norm. Whether commuting, scrolling through social feeds, or grabbing a quick peek in public, people lean on visuals, often skipping audio altogether. Captions or visuals that carry the message alone become essential, not just helpful extras. It’s clear that to catch eyes—and keep them—videos must tell their story visually first, audio a nice-to-have second.
Conclusion
When you take all these statistics together, one thing is impossible to ignore: video is not just part of the online experience—it is the online experience. From the billions of views YouTube racks up daily, to the overwhelming dominance of mobile viewing, to the way livestreaming continues to surge across regions, the trend lines all point in one direction.
We’re watching more, for longer, and in more diverse ways than ever before. The fact that most people now watch videos silently, that only a sliver of content ever truly goes viral, or that short-form dominates engagement, shows that video isn’t one-size-fits-all—it adapts to context, mood, and technology.
In the end, video has become the common language of the digital age, connecting people globally through shared habits, entertainment, and even silent scrolls. The story these stats tell is simple: online video isn’t slowing down—it’s only getting bigger, sharper, and more deeply woven into daily life.

