Introduction: Logging Matters, Here’s Why
Scaling from a few dozen jobs to hundreds is challenging for several reasons, one of which is observability. Observability is the ability to understand the system by analyzing components such as logs, metrics, and traces. This is just as relevant for smaller data teams with only a few pipelines to monitor, and distributed computing engines like Spark can be challenging to reliably monitor, debug, and create mature escalation procedures.
Logging is arguably the simplest and most impactful of these observability components. Clicking and scrolling through logs, one job run at a time, is not scalable. It can be time-consuming, difficult to parse, and often requires subject-matter expertise of the workflow. Without building mature logging standards into your data pipelines, troubleshooting errors or job failures takes significantly longer, leading to costly outages, ineffective tiers of escalation, and alert fatigue.
In this blog, we’ll walk you through:
- Steps to break away from basic print statements and set up a proper logging framework.
- When to configure the Spark log4j logs to use JSON format.
- Why centralize cluster log storage for easy parsing and querying.
- How to create a central AI/BI dashboard in Databricks that you can set up in your own workspace for more customized log analysis.
Key Architectural Considerations
The following considerations are important to keep in mind to tailor these logging recommendations to your organization:
Logging Libraries
- Several logging libraries exist for both Python and Scala. Our examples use Log4j and the standard Python logging module.
- Configuration for logging libraries or frameworks will be different, and you should consult their respective documentation if using a non-standard tool.
Cluster Types
- Examples in this blog will focus primarily on the following compute:
- At the time of this writing, the following compute types have less support for log delivery, although recommendations for logging frameworks still apply:
- Lakeflow Declarative Pipelines (formerly DLT): Only supports event logs
- Serverless Jobs: Does not support log delivery
- Serverless Notebooks: Does not support log delivery
Data Governance
- Data governance should extend to cluster logs, as logs may accidentally expose sensitive data. For example, when you write logs to a table, you should consider which users have access to the table and utilize least privilege access design.
- We will demonstrate how to deliver cluster logs to Unity Catalog volumes for simpler access control and lineage. Log delivery to Volumes is in Public Preview and is only supported on Unity Catalog-enabled compute with Standard access mode or Dedicated access mode assigned to a user.
- This feature is not supported on compute with Dedicated access mode assigned to a group.
Technical Solution Breakdown
Standardization is key to production-grade log observability.. Ideally, the solution should accommodate hundreds or even thousands of jobs/pipelines/clusters.
For the full implementation of this solution, please visit this repo here: https://github.com/databricks-industry-solutions/watchtower
Creating a Volume for central log delivery
First, we can create a Unity Catalog Volume to be our central file storage for logs. We do not recommend DBFS as it does not provide the same level of data governance. We recommend separating logs for each environment (e.g., dev, stage, prod) into different directories or volumes so access can be controlled more granularly.
You can create this in the UI, inside a Databricks Asset Bundle (AWS | Azure | GCP), or in our case, with Terraform:
Please ensure you have the READ VOLUME and WRITE VOLUME permissions on the volume (AWS | Azure | GCP).
Configure Cluster log delivery
Now that we have a central place to put our logs, we need to configure clusters to deliver their logs into this destination. To do this, configure compute log delivery (AWS | Azure | GCP) on the cluster.
Again, use the UI, Terraform, or other preferred method; we will use Databricks Asset Bundles (YAML):
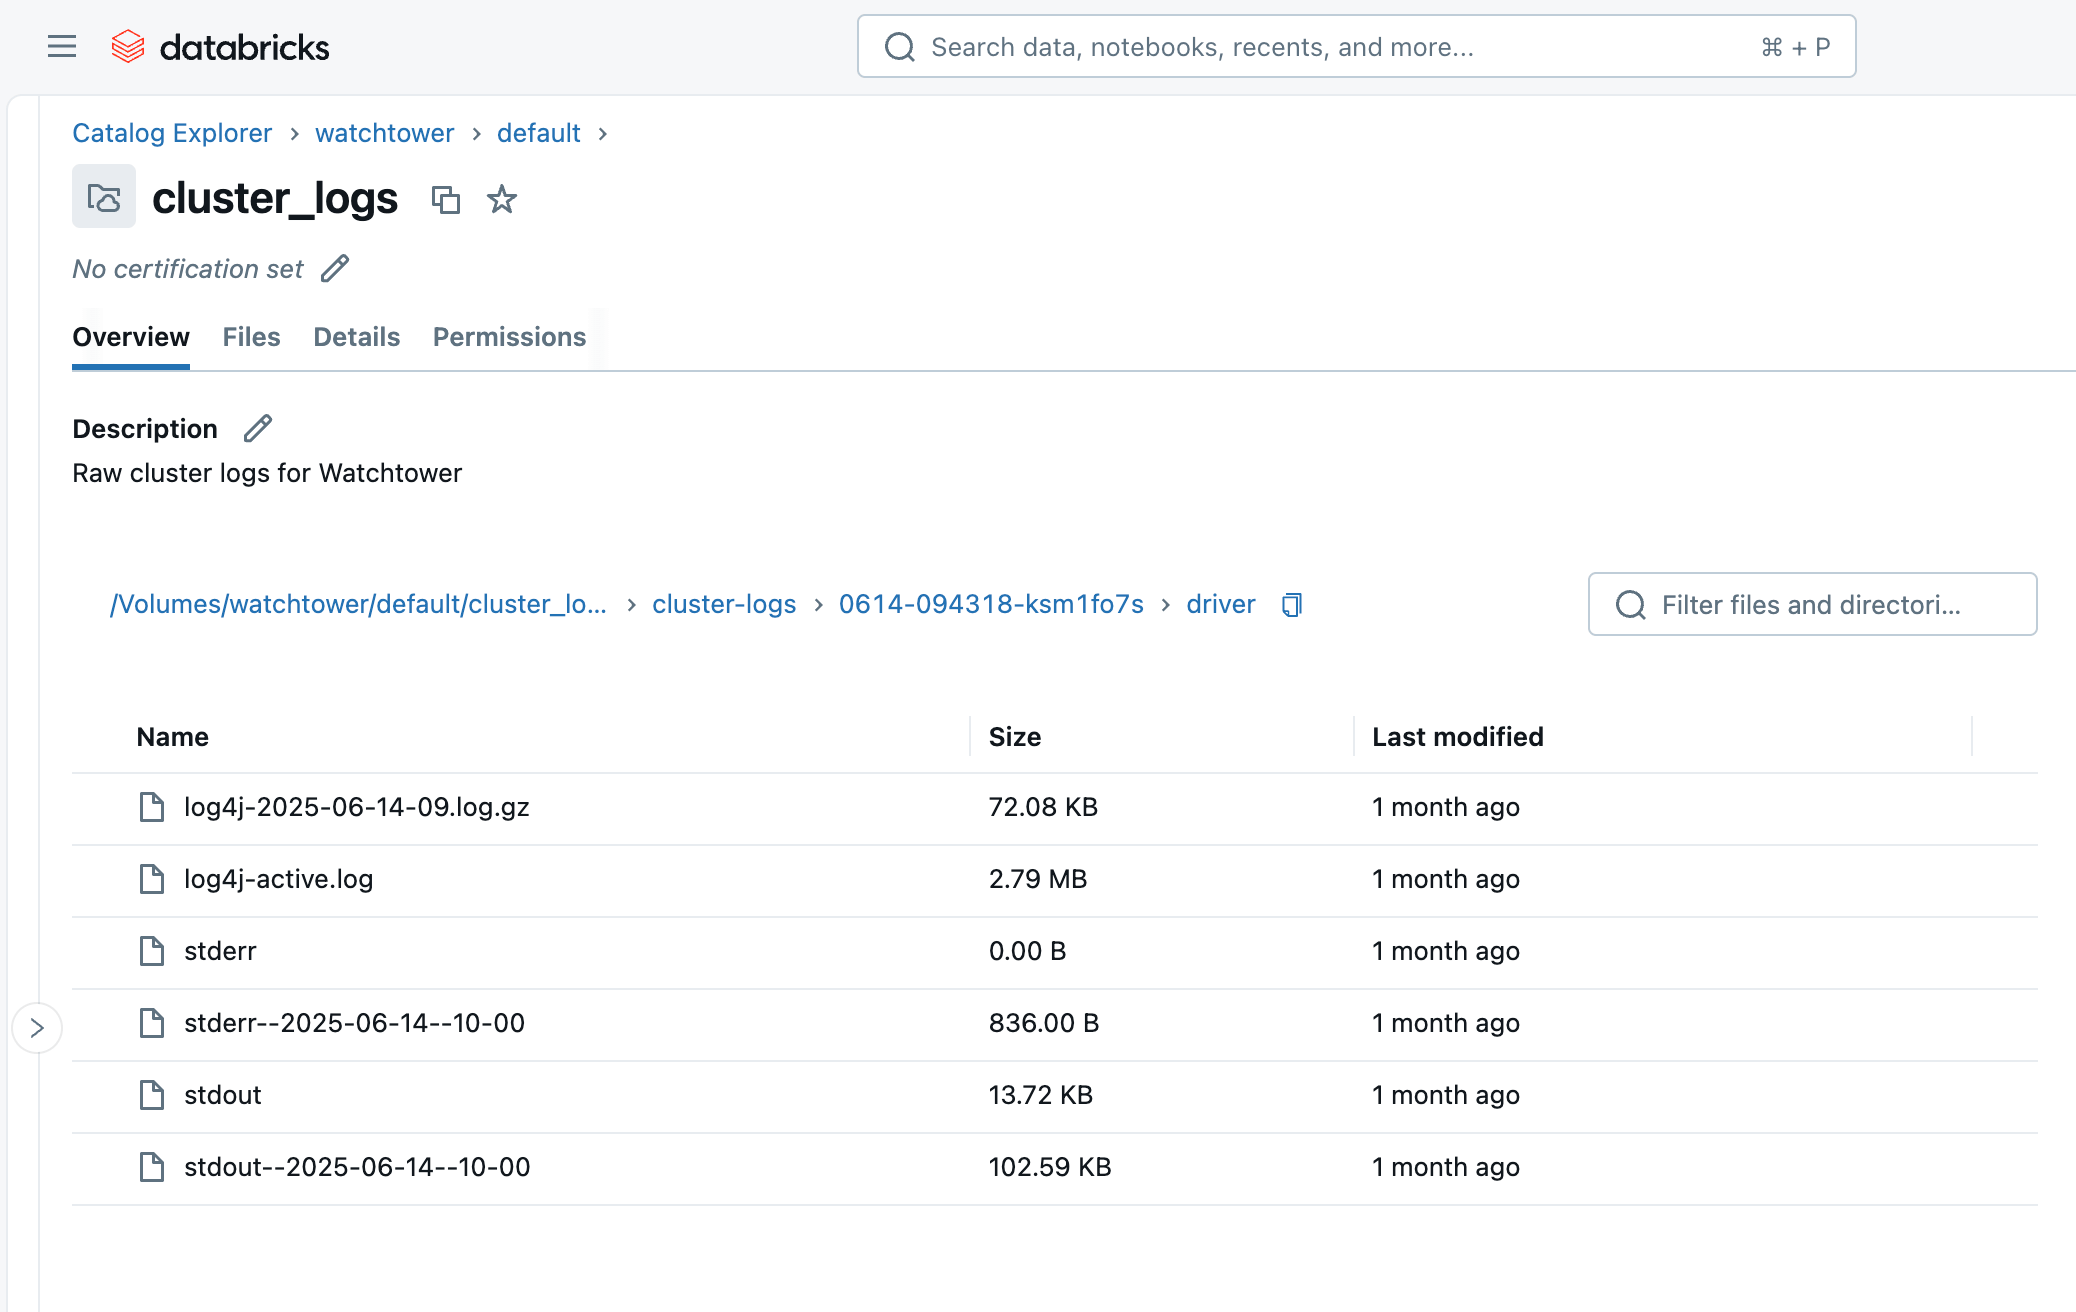
Upon running the cluster or job, within a few minutes, we can browse to the Volume in the Catalog Explorer and see the files arriving. You will see a folder with the cluster ID (i.e., 0614-174319-rbzrs7rq), then folders for each group of logs:
- driver: Logs from the Driver node, which we are most interested in.
- executor: Logs from each Spark executor in the cluster.
- eventlog: logs of events you can find in the “Event Log” tab of the cluster, such as cluster starting, cluster terminating, resizing, etc.
- init_scripts: This folder is generated if the cluster has init scripts, as ours does. Subfolders are created for each node in the cluster, and then stdout and stderr logs can be found for each init script that was executed on the node.
Enforcing Standards: Cluster Policy
Workspace admins should enforce standard configurations whenever possible. This means restricting cluster creation access, and giving users a Cluster Policy (AWS | Azure | GCP) with the cluster log configuration set to fixed values as shown below:
Setting these attributes to a “fixed” value automatically configures the correct Volume destination and prevents users from forgetting or changing the property.
Now, instead of explicitly configuring the cluster_log_conf in your asset bundle YAML, we can simply specify the cluster policy ID to use:
More than just a print() statement
While print() statements can be useful for quick debugging during development, they fall short in production environments for several reasons:
- Lack of structure: Print statements produce unstructured text, making it difficult to parse, query, and analyze logs at scale.
- Limited context: They often lack essential contextual information like timestamps, log levels (e.g., INFO, WARNING, ERROR), originating module, or job ID, which are crucial for effective troubleshooting.
- Performance overhead: Excessive print statements can introduce performance overhead as they trigger an evaluation in Spark. Print statements also write directly to standard output (stdout) without buffering or optimized handling.
- No control over verbosity: There’s no built-in mechanism to control the verbosity of print statements, leading to logs either being too noisy or insufficient in detail.
Proper logging frameworks, like Log4j for Scala/Java (JVM) or the built-in logging module for Python, solve all these problems and are preferred in production. These frameworks let us define log levels or verbosity, output machine-friendly formats like JSON and set flexible destinations.
Please also note the difference between stdout vs. stderr vs. log4j in Spark driver logs:
- stdout: Standard Output buffer from the driver node’s JVM. This is where
print()statements and general output are written by default. - stderr: Standard Error buffer from the driver node’s JVM. This is typically where exceptions/stacktraces are written, and many logging libraries also default to stderr.
- log4j: Specifically filtered to log messages written with a log4j logger. You may see these in messages in stderr as well.
Python
In Python, this involves importing the standard logging module, defining a JSON format, and setting your log level.
As of Spark 4, or Databricks Runtime 17.0+, a simplified structured logger is built into PySpark: https://spark.apache.org/docs/latest/api/python/development/logger.html. The following example can be adapted to PySpark 4 by swapping the logger instance for a pyspark.logger.PySparkLogger instance.
Much of this code is just to format our Python log messages as JSON. JSON is semi-structured and easy to read for both humans and machines, which we’ll come to appreciate when ingesting and querying these logs later in this blog. If we skipped this step, you may find yourself relying on complex, inefficient regular expressions to guess at which part of the message is the log level versus a timestamp versus the message, etc.
Of course, this is fairly verbose to include in every notebook or Python package. To avoid duplication, this boilerplate may be packaged up as utility code and loaded to your jobs in a few ways:
- Put the boilerplate code in a Python module on the workspace and use workspace file imports (AWS | Azure | GCP) to execute the code at the start of your main notebooks.
- Build the boilerplate code into a Python wheel file and load it onto the clusters as a Library (AWS | Azure | GCP).
Scala
The same principles apply to Scala, but we will use Log4j instead, or more specifically, the SLF4j abstraction:
When we view the Driver Logs in the UI, we can find our INFO and WARN log messages under Log4j. This is because the default log level is INFO, so the DEBUG and TRACE messages are not written.
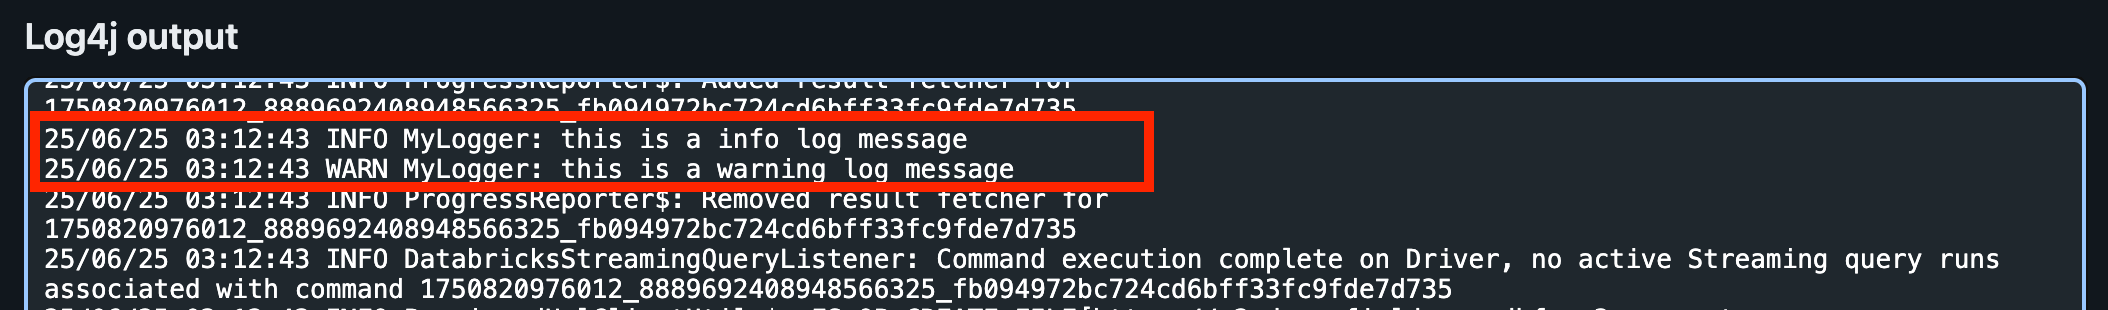
The Log4j logs are not in JSON format, though! We’ll see how to fix that next.
Logging for Spark Structured Streaming
To capture useful information for streaming jobs, such as streaming source and sink metrics and query progress, we can also implement the StreamingQueryListener from Spark.
Then register the query listener with your Spark session:
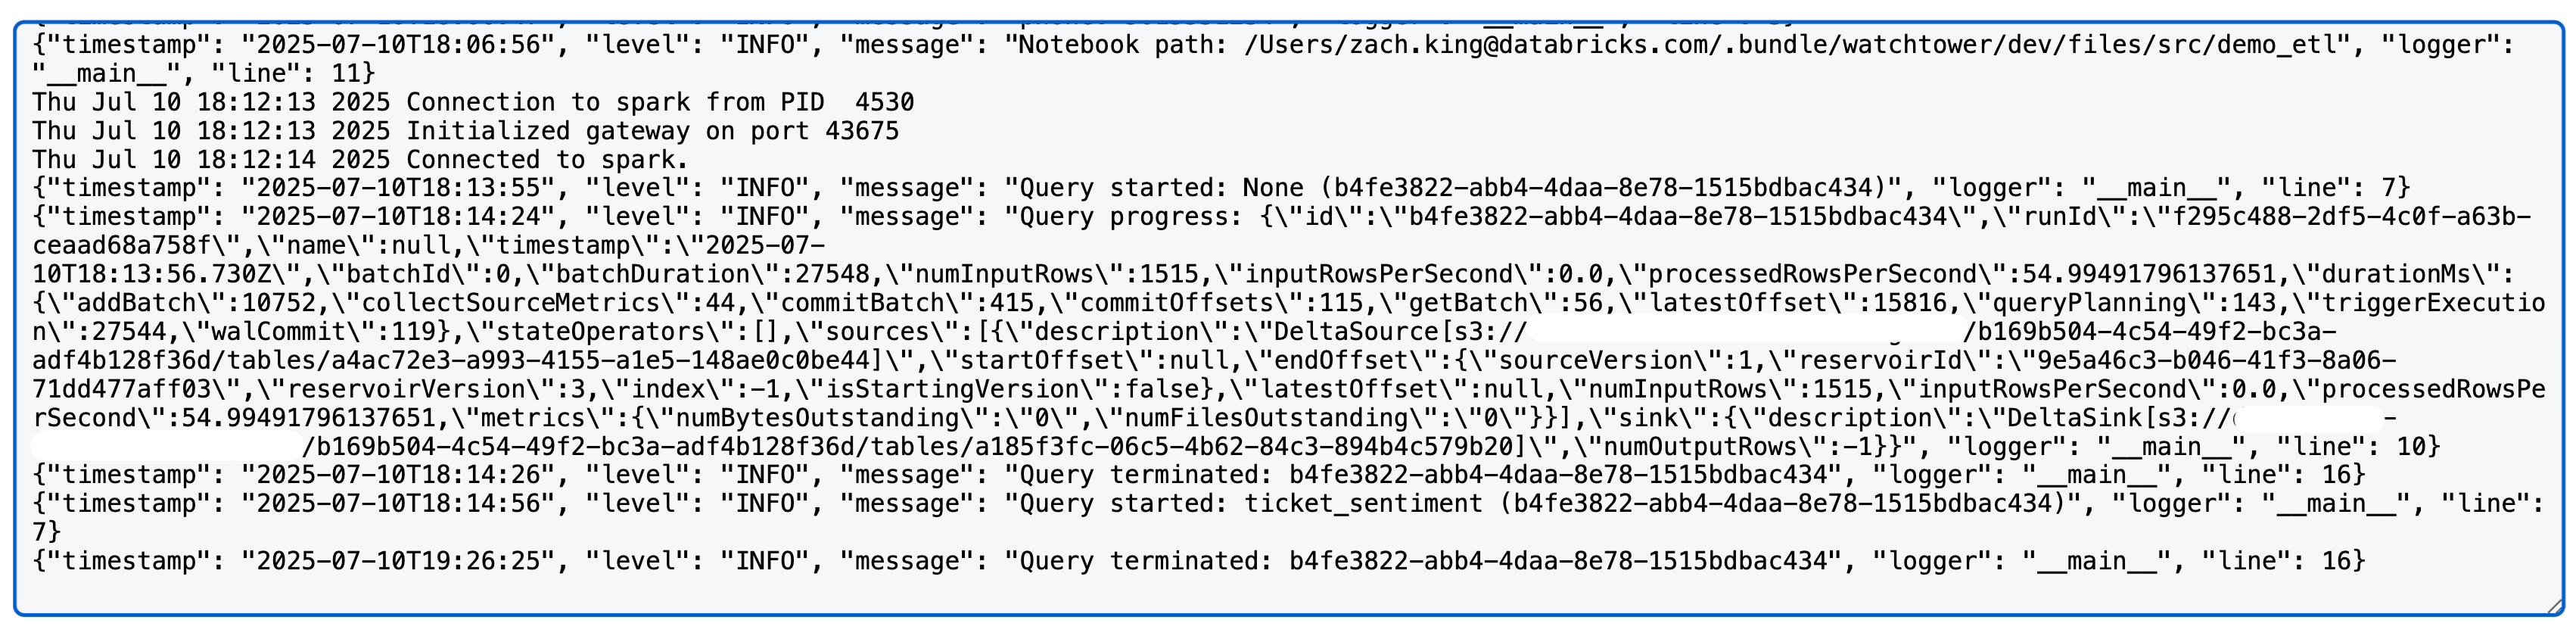
Upon running a Spark structured streaming query, you will now see something like the following in the log4j logs (note: we use a Delta source and sink in this case; detailed metrics may vary by source/sink):
Configuring the Spark Log4j Logs
Until now, we have only affected our own code’s logging. However, looking at the cluster’s Driver Logs, we can see many more logs–the majority, in fact–are from Spark internals. When we create Python or Scala loggers in our code, this does not influence the Spark internal logs.
We will now review how to configure the Spark logs for the Driver node so that they use standard JSON format that we can easily parse.
Log4j uses a local configuration file to control formatting and log levels, and we can modify this configuration using a Cluster Init Script (AWS | Azure | GCP). Please note that prior to DBR 11.0, Log4j v1.x was used, which uses a Java Properties (log4j.properties) file. DBR 11.0+ uses Log4j v2.x which uses an XML (log4j2.xml) file instead.
The default log4j2.xml file on Databricks driver nodes uses a PatternLayout for a basic log format:
We will change this to the JsonTemplateLayout using the following init script:
This init script simply swaps out the PatternLayout for JsonTemplateLayout. Note that init scripts execute on all nodes in the cluster, including worker nodes; in this example, we are only configuring the Driver logs for verbosity’s sake and because we will only be ingesting the Driver logs later. However, the config file can also be found on worker nodes at /home/ubuntu/databricks/spark/dbconf/log4j/executor/log4j.properties.
You may add to this script as needed, or cat $LOG4J2_PATH to view the full contents of the original file for easier modifications.
Next, we will upload this init script to the Unity Catalog Volume. For organization, we will create a separate Volume rather than reuse our raw logs volume from earlier, and this can be accomplished in Terraform like so:
This will create the Volume and automatically upload the init script to it.
But we still need to configure our cluster to use this init script. Earlier, we used a Cluster Policy to enforce the Log Delivery destination, and we can do the same type of enforcement for this init script to ensure our Spark logs always have the structured JSON formatting. We will modify the earlier policy JSON by adding the following:
Again, using a fixed value here guarantees the init script will always be set on the cluster.
Now, if we re-run our Spark code from earlier, we can see all of the Driver Logs in the Log4j section are nicely formatted as JSON!
Ingesting the logs
At this point, we’ve ditched basic print statements for structured logging, unified that with Spark’s logs, and routed our logs to a central Volume. This is already useful for browsing and downloading the log files using the Catalog Explorer or Databricks CLI: databricks fs cp dbfs:/Volumes/watchtower/default/cluster_logs/cluster-logs/$CLUSTER_ID . --recursive.
However, the true value of this logging hub is seen when we ingest the logs to a Unity Catalog table. This closes the loop and gives us a table against which we can write expressive queries, perform aggregations, and even detect common performance issues. All of this we’ll get to shortly!
Ingesting the logs is easy thanks to Lakeflow Declarative Pipelines, and we’ll employ a medallion architecture with Auto Loader to incrementally load the data.
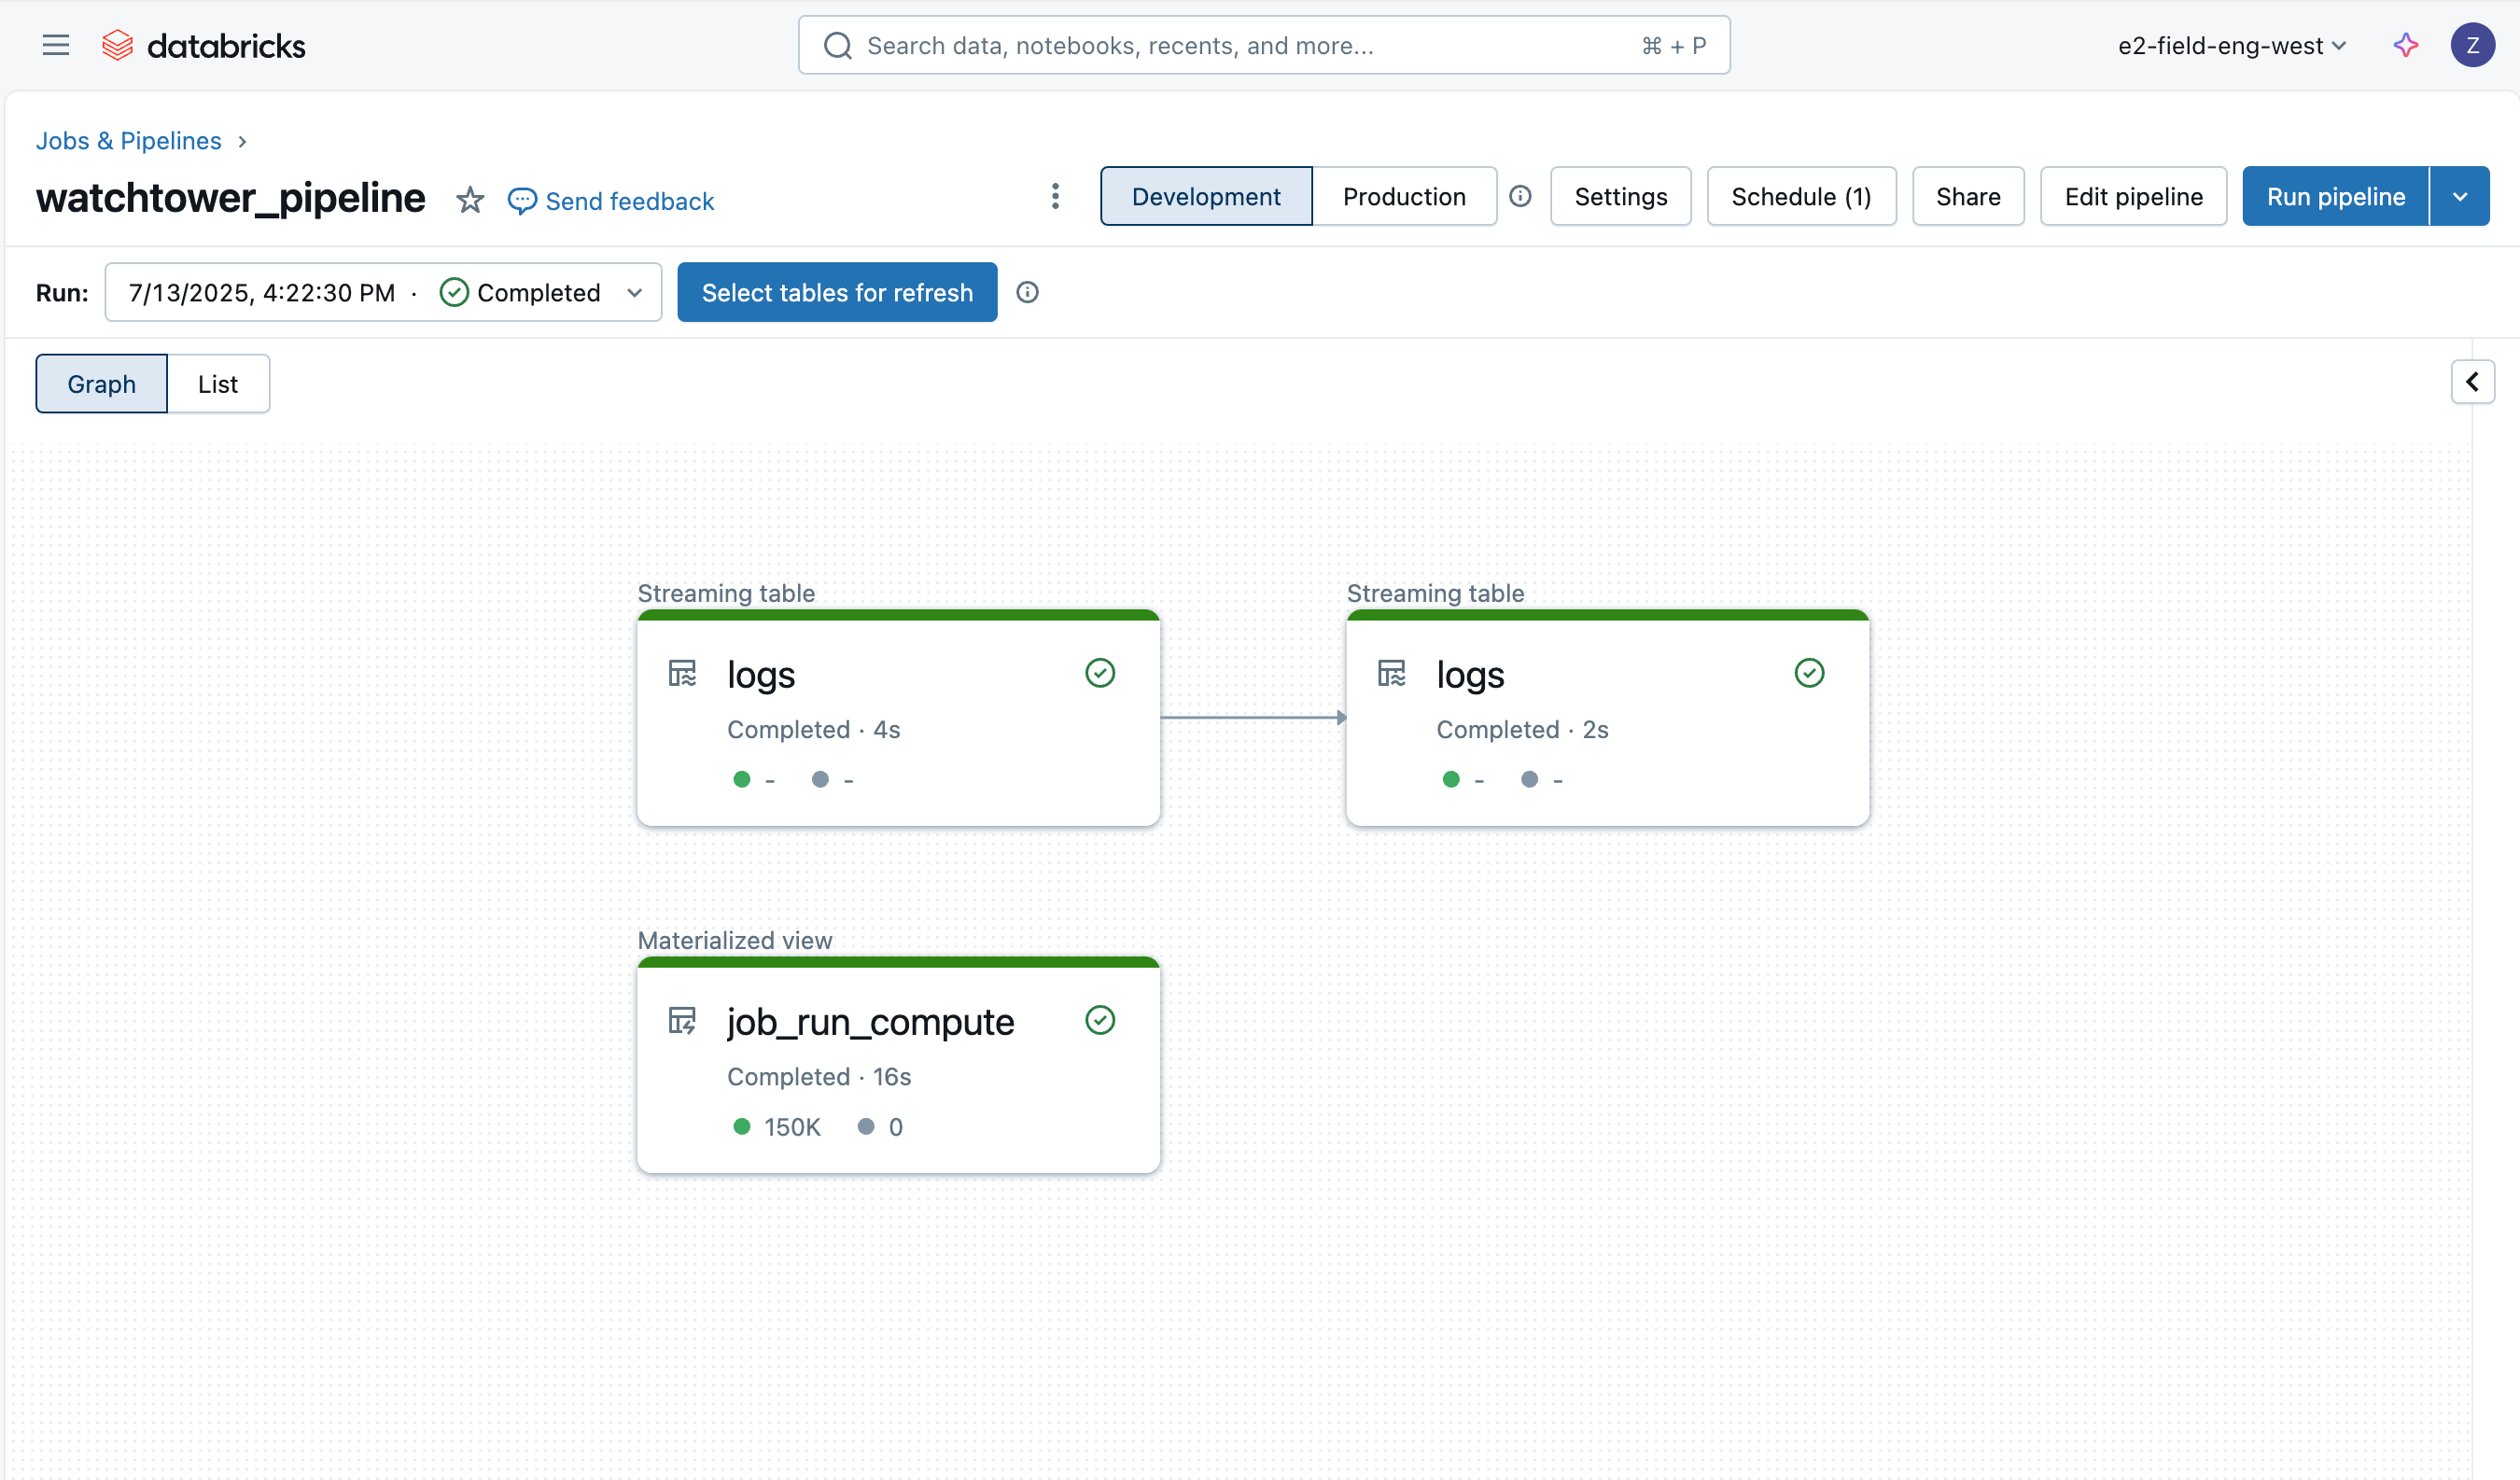
Bronze Logs
The first table is simply a bronze table to load the raw driver log data, appending some additional columns such as the file name, size, path, and last modification time.
Using Lakeflow Declarative Pipeline’s expectations (AWS | Azure | GCP), we also get native data quality monitoring. We will see more of these data quality checks on the other tables.
Silver Logs
The next (silver) table is more critical; we would like to parse each line of text from the logs, extracting information such as the log level, log timestamp, cluster ID, and log source (stdout/stderr/log4j).
Note: although we have configured JSON logging as much as possible, we will always have some degree of raw text in unstructured form from other tools launched at startup. Most of these will be in stdout, and our silver transformation demonstrates one way to keep parsing flexible, by attempting to parse the message as JSON and falling back to regex only when necessary.
Compute IDs
The last table in our pipeline is a materialized view built upon Databricks System Tables. It will store the compute IDs used by each job run and simplify future joins when we wish to retrieve the job ID that produced certain logs. Note that a single job may have multiple clusters, as well as SQL tasks that execute on a warehouse rather than a job cluster, thus the usefulness of precomputing this reference.
Deploying the Pipeline
The pipeline can be deployed through the UI, Terraform, or within our asset bundle. We will use the asset bundle and provide the following resource YAML:
Analyze Logs with AI/BI Dashboard
Finally, we can query the log data across jobs, job runs, clusters, and workspaces. Thanks to the optimizations of Unity Catalog managed tables, these queries will also be fast and scalable. Let’s see a couple of examples.
Top N Errors
This query finds the most common errors encountered, helping to prioritize and improve error handling. It can also be a useful indicator for writing runbooks that cover the most common issues.
Top N Jobs by Errors
This query ranks jobs by the number of errors observed, helping to find the most problematic jobs.
AI/BI Dashboard
If we put these queries into a Databricks AI/BI dashboard, we now have a central interface to search and filter all logs, detect common issues, and troubleshoot.
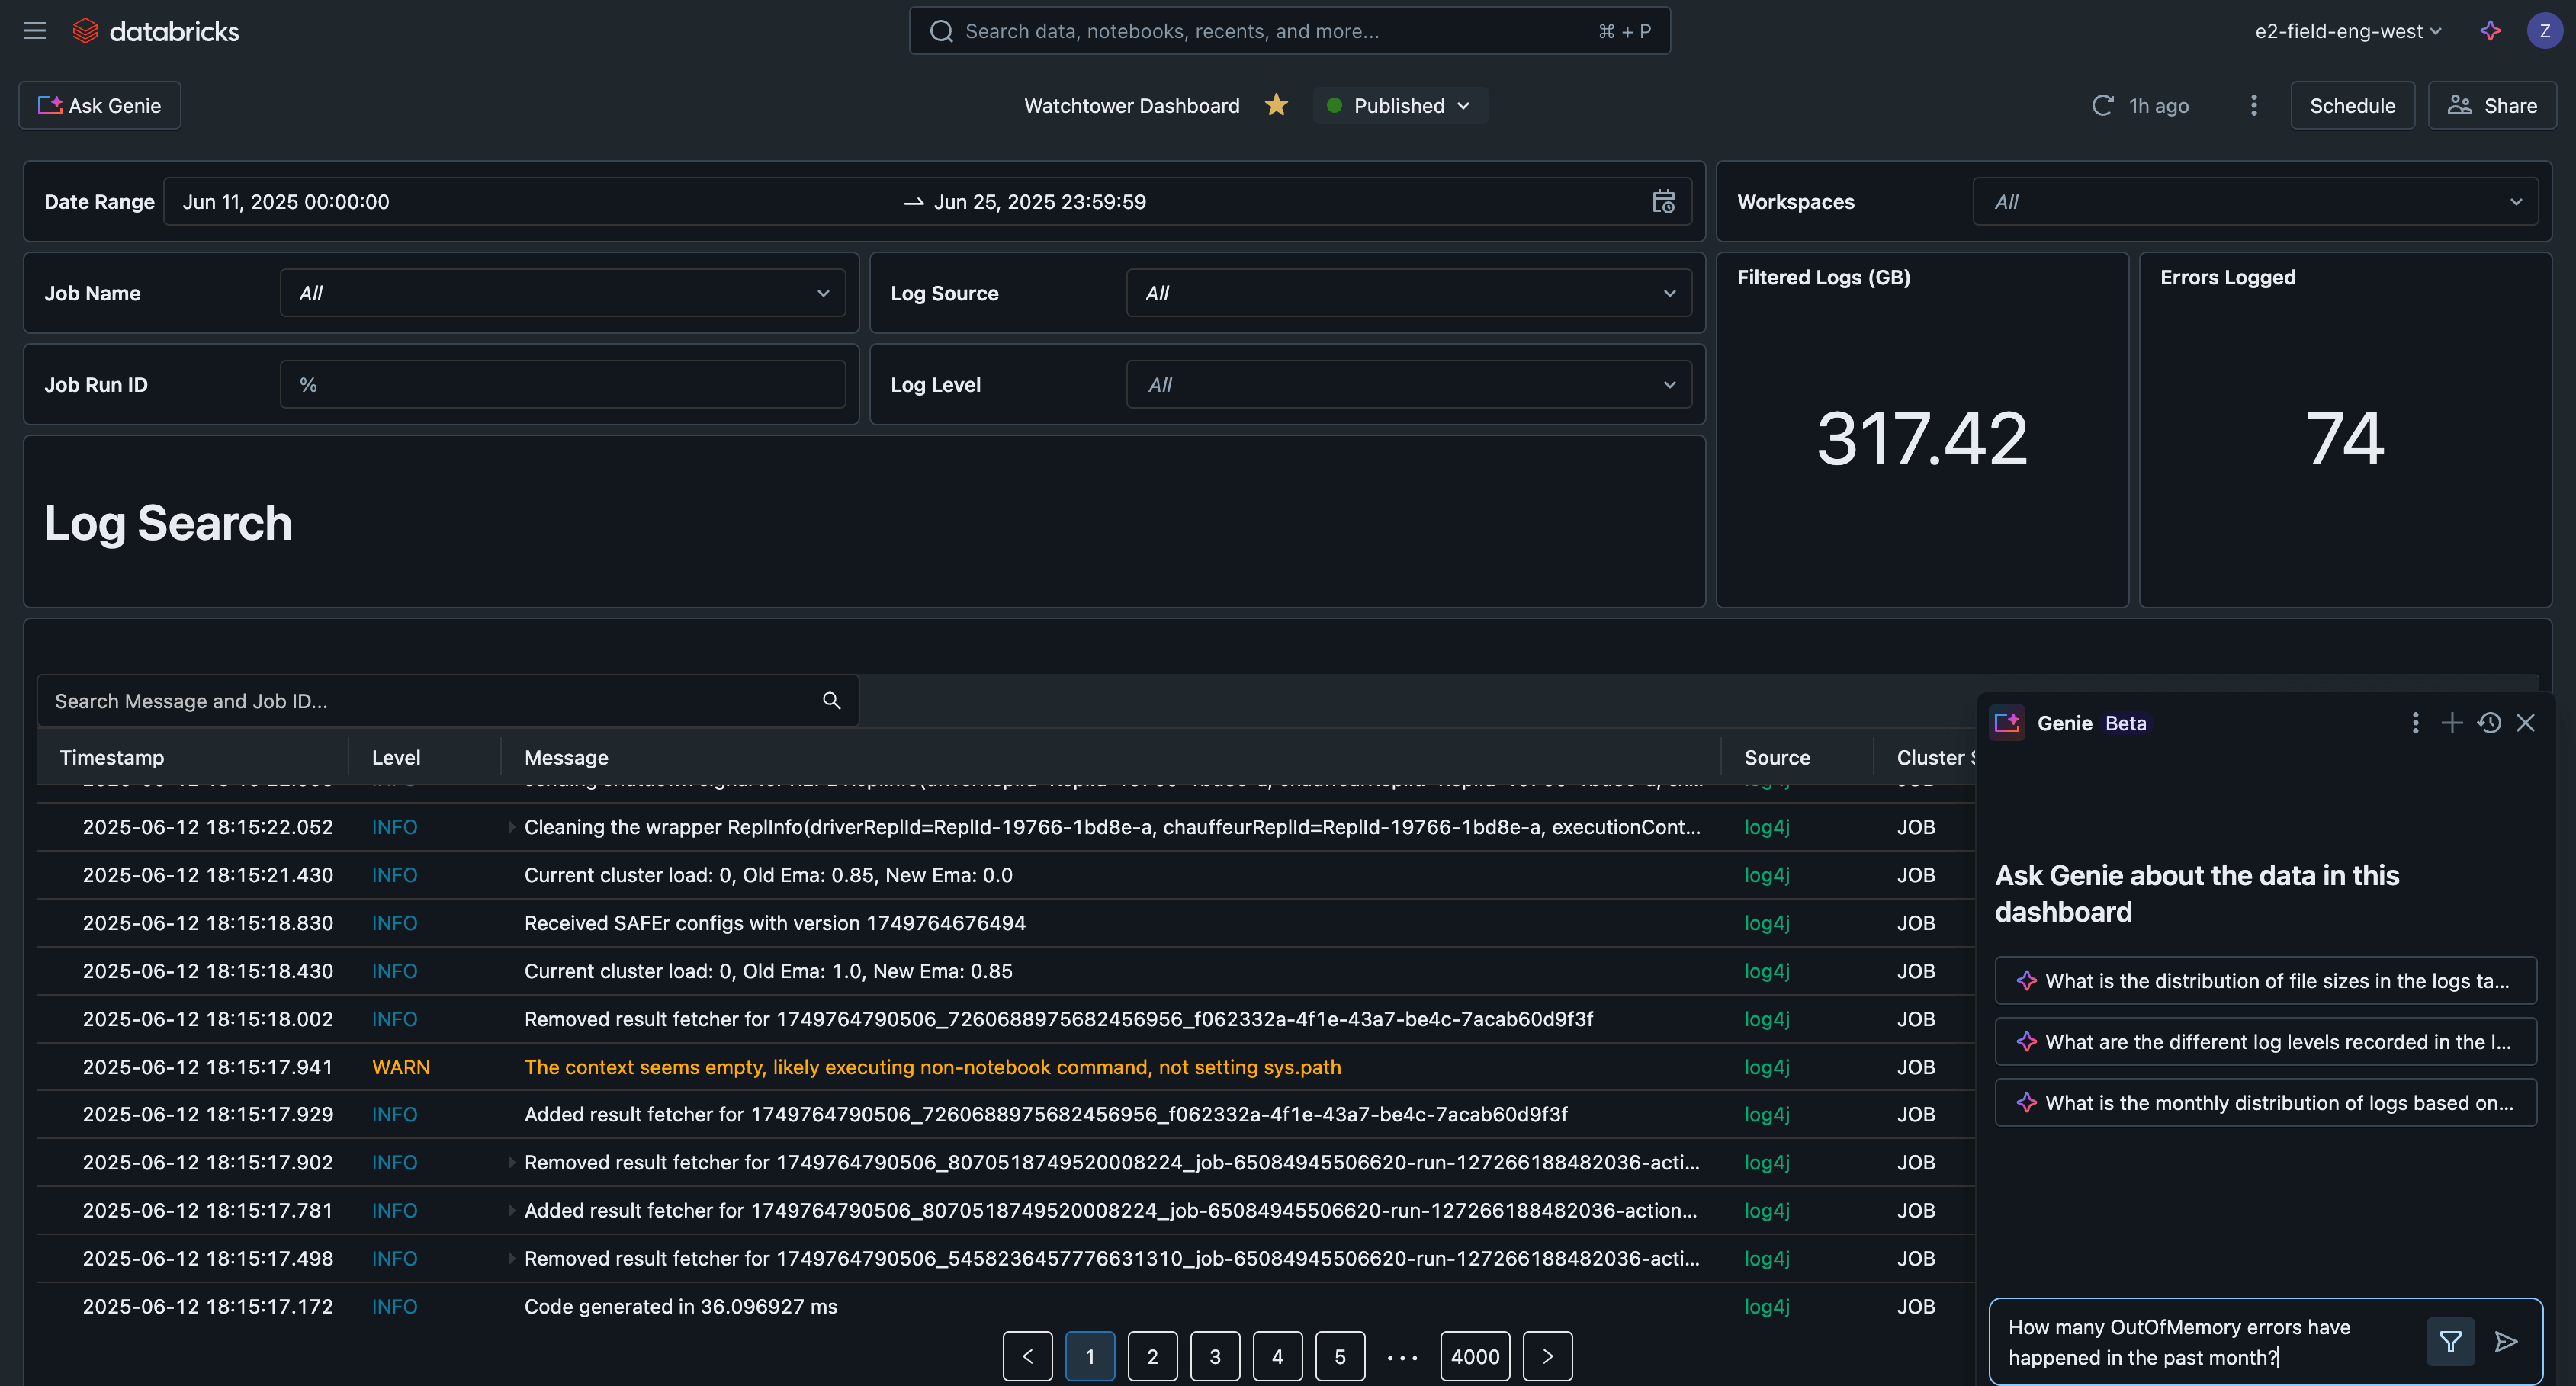
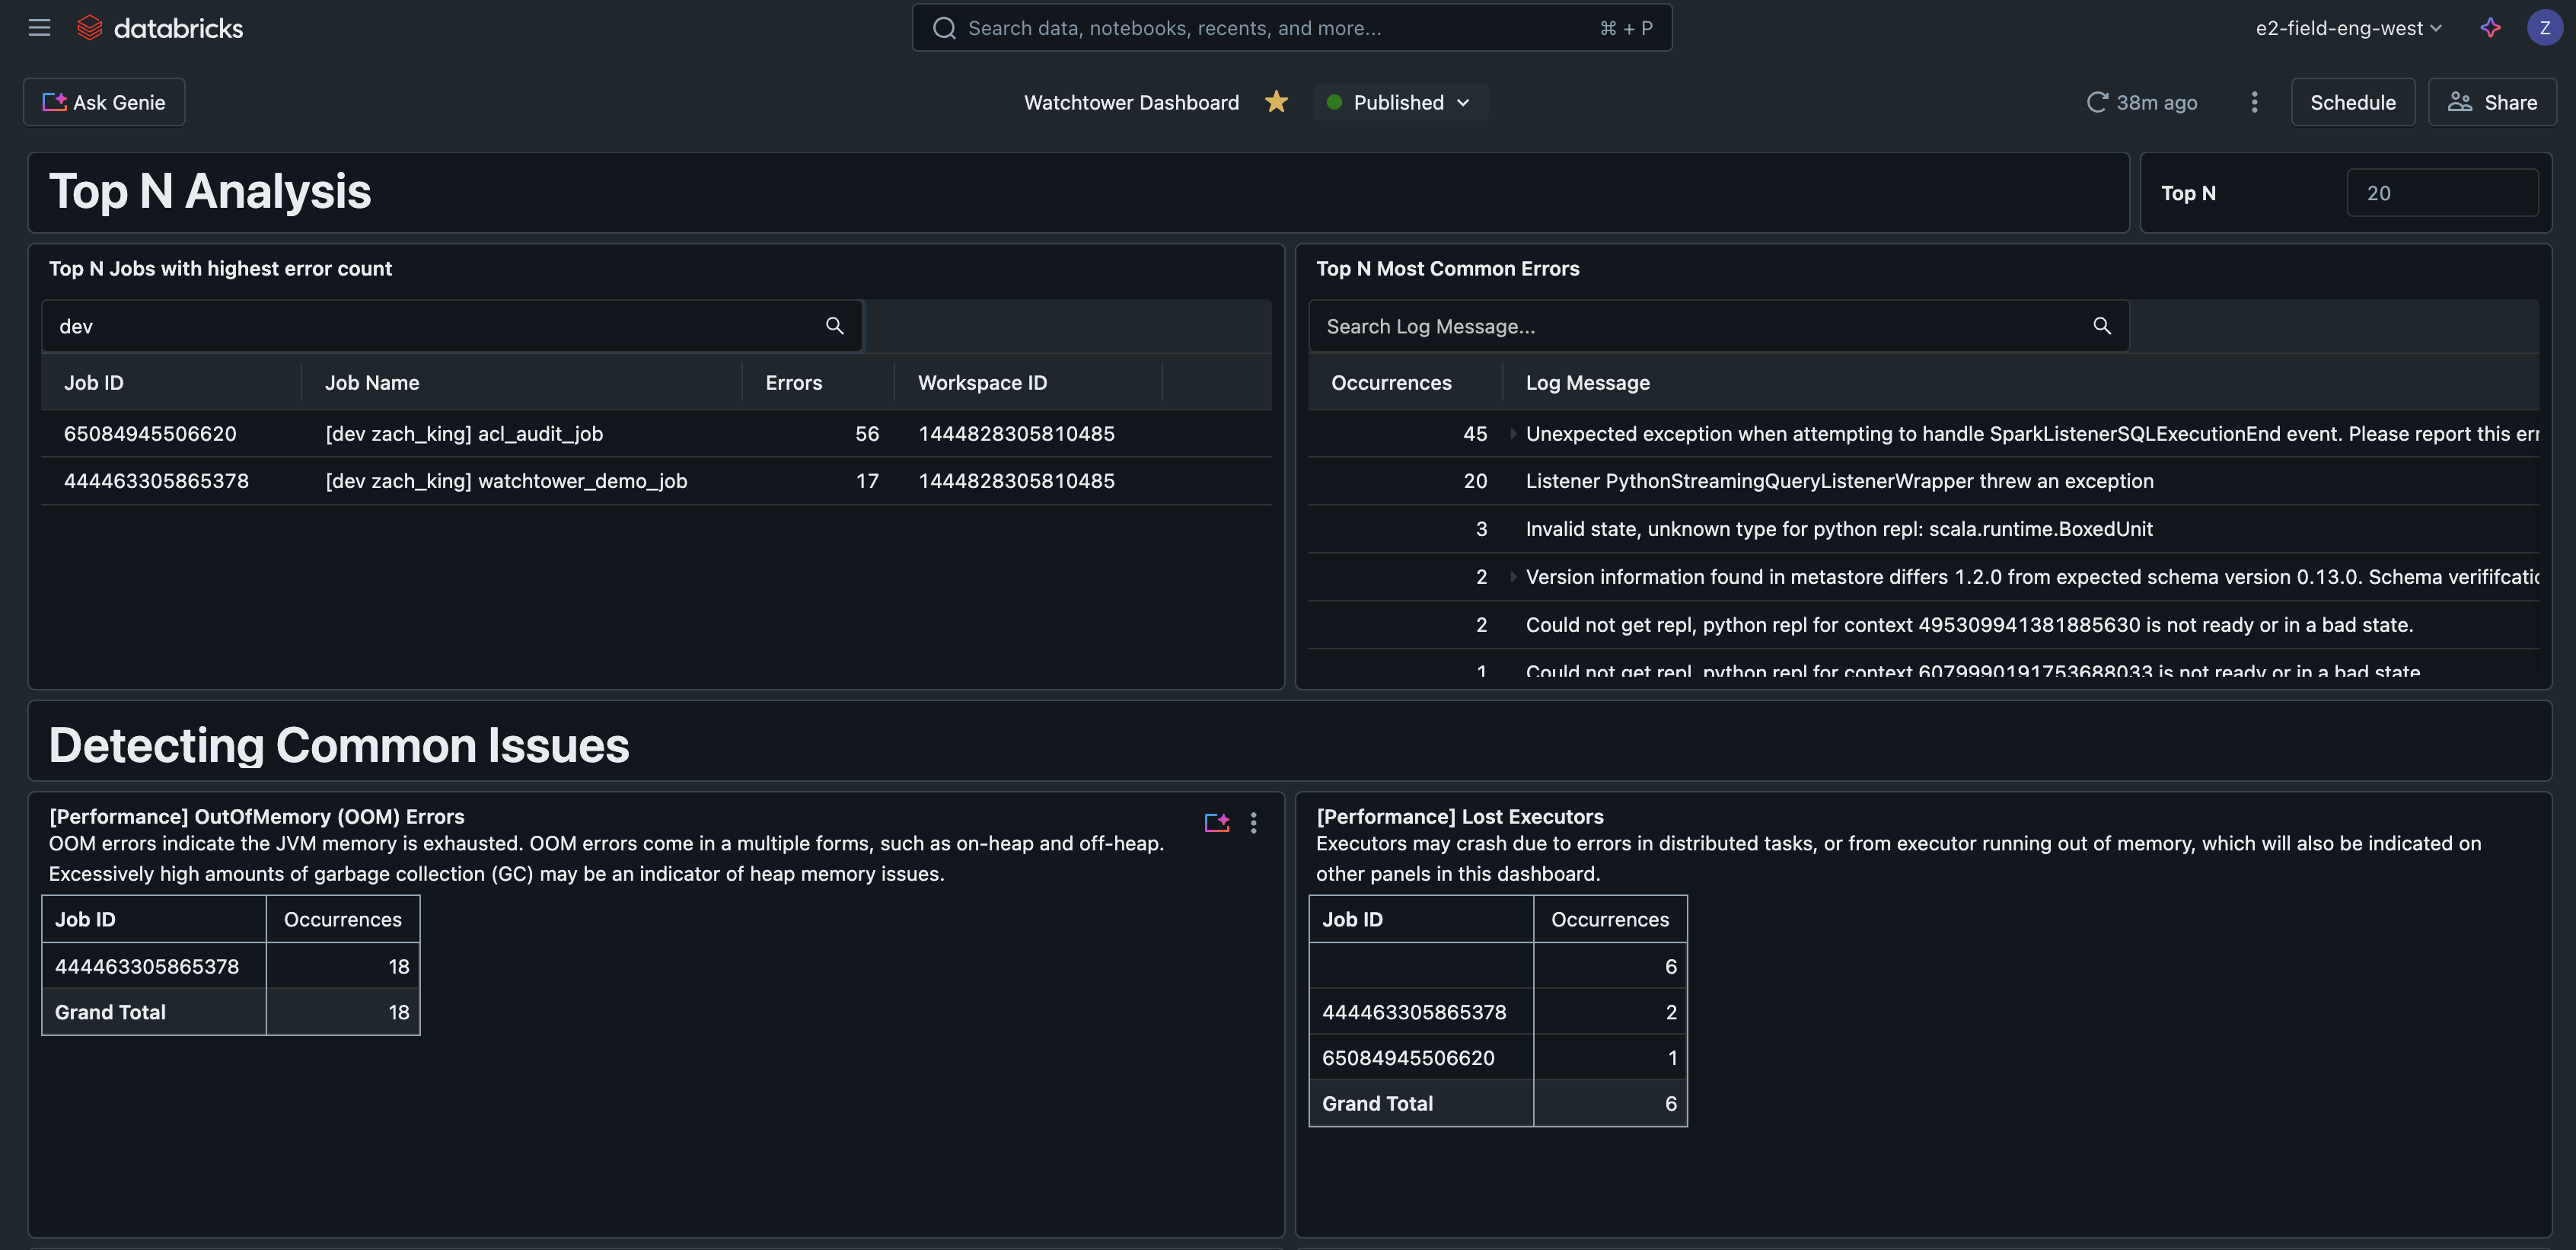
This example AI/BI dashboard is available along with all other code for this solution on GitHub.
Real-World Scenarios
As we have demonstrated in the reference dashboard, there are many practical use-cases that a logging solution like this supports, such as:
- Search logs across all runs for a single job
- Search logs across all jobs
- Analyzing logs for the most common errors
- Find jobs with the highest number of errors
- Monitoring for performance issues or warnings:
- Detecting PII in logs
In a realistic scenario, practitioners are manually jumping around from one job run to the next to make sense of errors, and do not know how to prioritize alerts. By not only establishing robust logs but also a standard table to store them, practitioners can simply query the logs for the most common error to be prioritized. Say there is 1 failed job run due to an OutOfMemory error, while there are 10 failed jobs due to a sudden permission error when SELECT was unintentionally revoked from the service principal; your on-call team is normally fatigued by the surge of alerts, but now is able to quickly realize the permission error is a higher priority and begins working to resolve the issue in order to restore the 10 jobs.
Similarly, practitioners often need to check logs for multiple runs of the same job to make comparisons. A real-world example is correlating timestamps of a specific log message from each batch run of the job, with another metric or graph (i.e., when “batch completed” was logged vs. a graph of request throughput on an API that you called). Ingesting the logs simplifies this, so we can query the table and filter to the job ID, and optionally a list of job run IDs, without needing to click into each run one at a time.
Operational Considerations
- Cluster Logs are delivered every five minutes and gzipped hourly in your chosen destination.
- Remember to use Unity Catalog-managed tables with Predictive Optimization and Liquid Clustering to get the best performance on tables.
- Raw logs do not need to be stored indefinitely, which is the default behavior when cluster log delivery is used. In our Declarative Pipelines pipeline, use the Auto Loader option
cloudFiles.cleanSourceto delete files after a specified retention period, also defined ascloudFiles.cleanSource.retentionDuration. You may also use cloud storage lifecycle rules. - Executor logs can also be configured and ingested, but they are generally not needed as most errors are propagated to the driver anyway.
- Consider adding Databricks SQL Alerts (AWS | Azure | GCP) for automated alerting based on the ingested logs table.
- Lakeflow Declarative Pipelines have their own event logs, which you may use to monitor and inspect pipeline activity. This event log can also be written to Unity Catalog.
Integrating and Jobs to be done
Customers may also wish to integrate their logs with popular logging tools such as Loki, Logstash, or AWS CloudWatch. While each has their own authentication, configuration, and connectivity requirements, these would all follow a very similar pattern using the cluster init script to configure and oftentimes run a log-forwarding agent.
Key Takeaways
To recap, the key lessons are:
- Use standardized logging frameworks, not print statements, in production.
- Use cluster-scoped init scripts to customize the Log4j config.
- Configure cluster log delivery to centralize logs.
- Use Unity Catalog managed tables with Predictive Optimization and Liquid Clustering for the best table performance.
- Databricks allows you to ingest and enrich logs for greater analysis.
Next Steps
Start productionizing your logs today by checking out the GitHub repo for this full solution here: https://github.com/databricks-industry-solutions/watchtower!
Databricks Delivery Solutions Architects (DSAs) accelerate Data and AI initiatives across organizations. They provide architectural leadership, optimize platforms for cost and performance, enhance developer experience, and drive successful project execution. DSAs bridge the gap between initial deployment and production-grade solutions, working closely with various teams, including data engineering, technical leads, executives, and other stakeholders to ensure tailored solutions and faster time to value. To benefit from a custom execution plan, strategic guidance, and support throughout your data and AI journey from a DSA, please contact your Databricks Account Team.