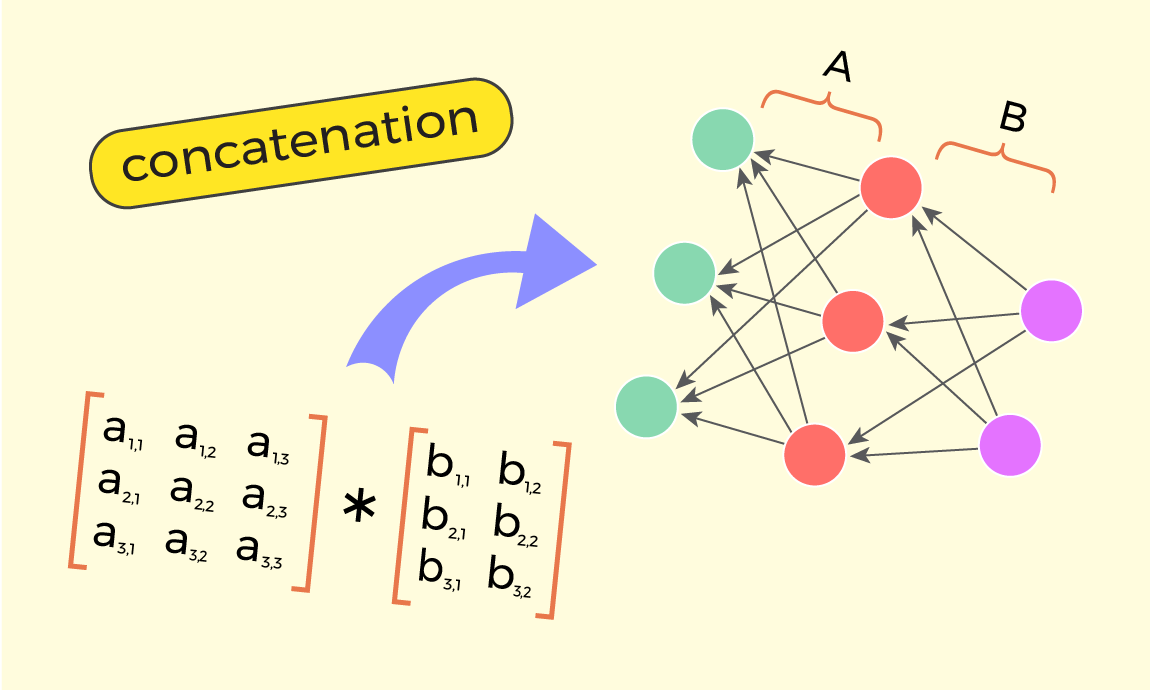
In the first story [1] of this series, we have: Addressed multiplication of a matrix by a vector, Introduced the concept of X-diagram for a
Category: Data Science

If features powered by LLMs, you already know how important evaluation is. Getting a model to say something is easy, but figuring out whether it’s

to lead the cloud industry with a whopping 32% share due to its early market entry, robust technology and comprehensive service offerings. However, many users

isn’t yet another explanation of the chain rule. It’s a tour through the bizarre side of autograd — where gradients serve physics, not just weights

Boston – June 19, 2025 – Ataccama announced the release of a report by Business Application Research Center (BARC), “The Rising Imperative for Data Observability,”

Image by Editor | Midjourney While Python-based tools like Streamlit are popular for creating data dashboards, Excel remains one of the most accessible and

Image by Author | Ideogram You’re architecting a new data pipeline or starting an analytics project, and you’re probably considering whether to use Python

Image by Author | ChatGPT Web development remains one of the most popular and in-demand professions, and it will continue to thrive even in

the initial response from an LLM doesn’t suit you? You rerun it, right? Now, if you were to automate that… success = false while not
scientist inevitably means working on multiple layers of abstraction, foremost abstractions of code and math. This is great, because this allows you to get astonishing